
Reading Options Levels
Key daily option levels for a ticker — gamma exposure, gamma flip and max pain — to frame support and resistance for the session.
What it is
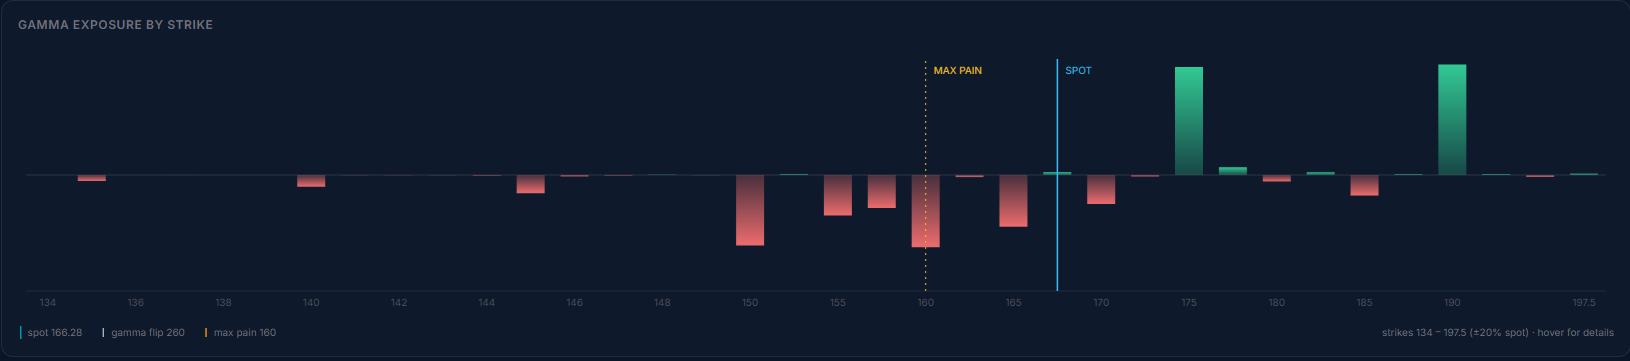
Options Levels maps where options open interest and gamma concentrate for a ticker: the gamma exposure (GEX) profile, expected moves by expiry, max pain, gamma walls and the call/put open-interest balance. It's precomputed for a set of actives, and you can look up any other ticker with an option chain.
Open it
Use the left rail to open Levels, which loads at /account/levels inside the same dashboard shell as Live Options Flow.
Pick a ticker
A row of chips lists the precomputed actives sorted by today's option volume, with SPY, QQQ, IWM, NVDA, TSLA and AAPL pinned first. Click a chip to load it, or type any other ticker into the search box to fetch its levels on demand.
Read the summary stats
The stat row up top gives you spot price, the expected move (± % and $ for the nearest expiry), max pain, gamma flip, the put/call open-interest ratio, and when the snapshot was last updated. Each is also shown as a % distance from spot where relevant.
Go deeper
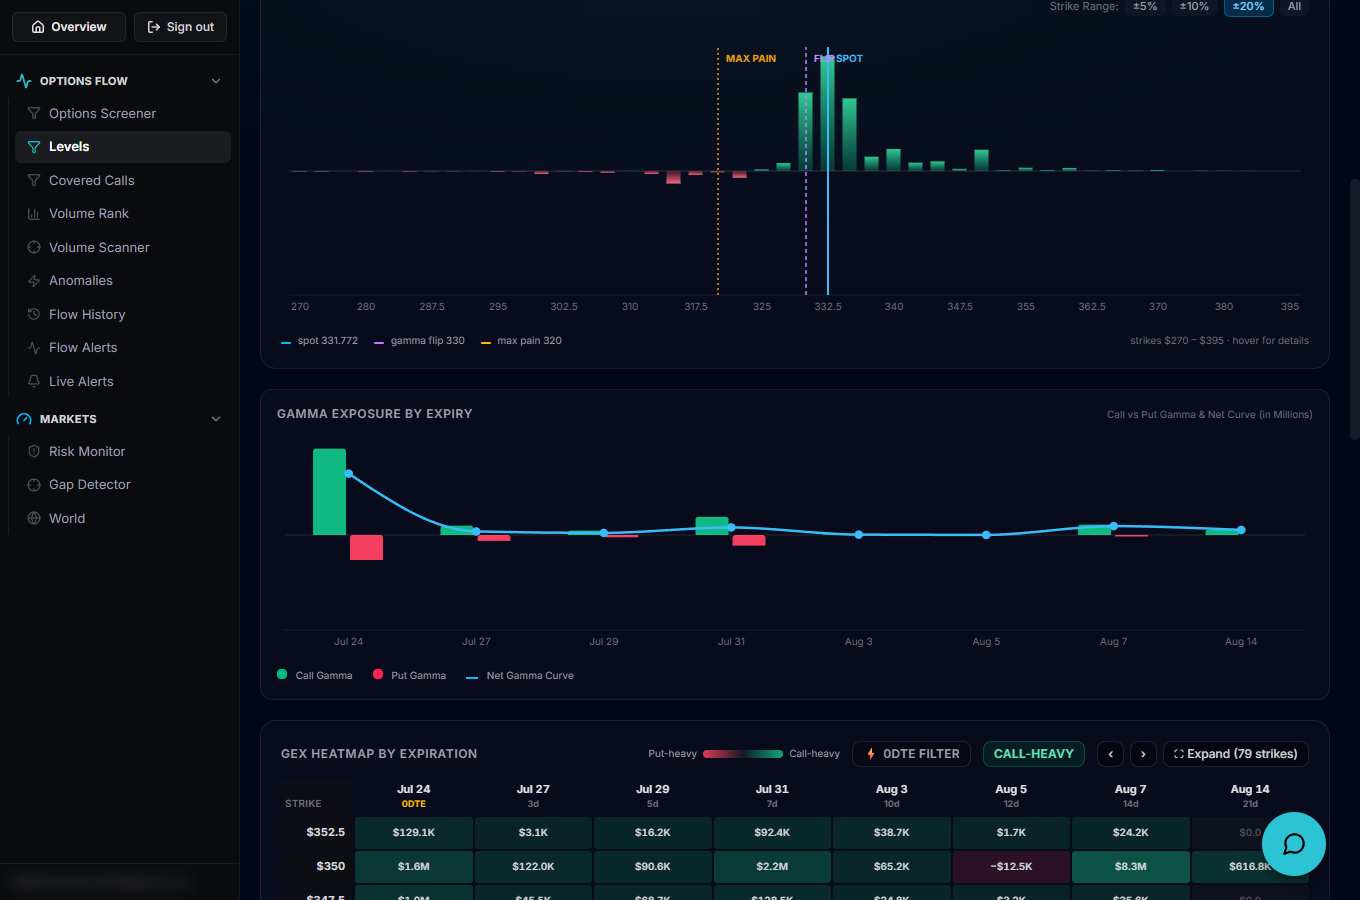
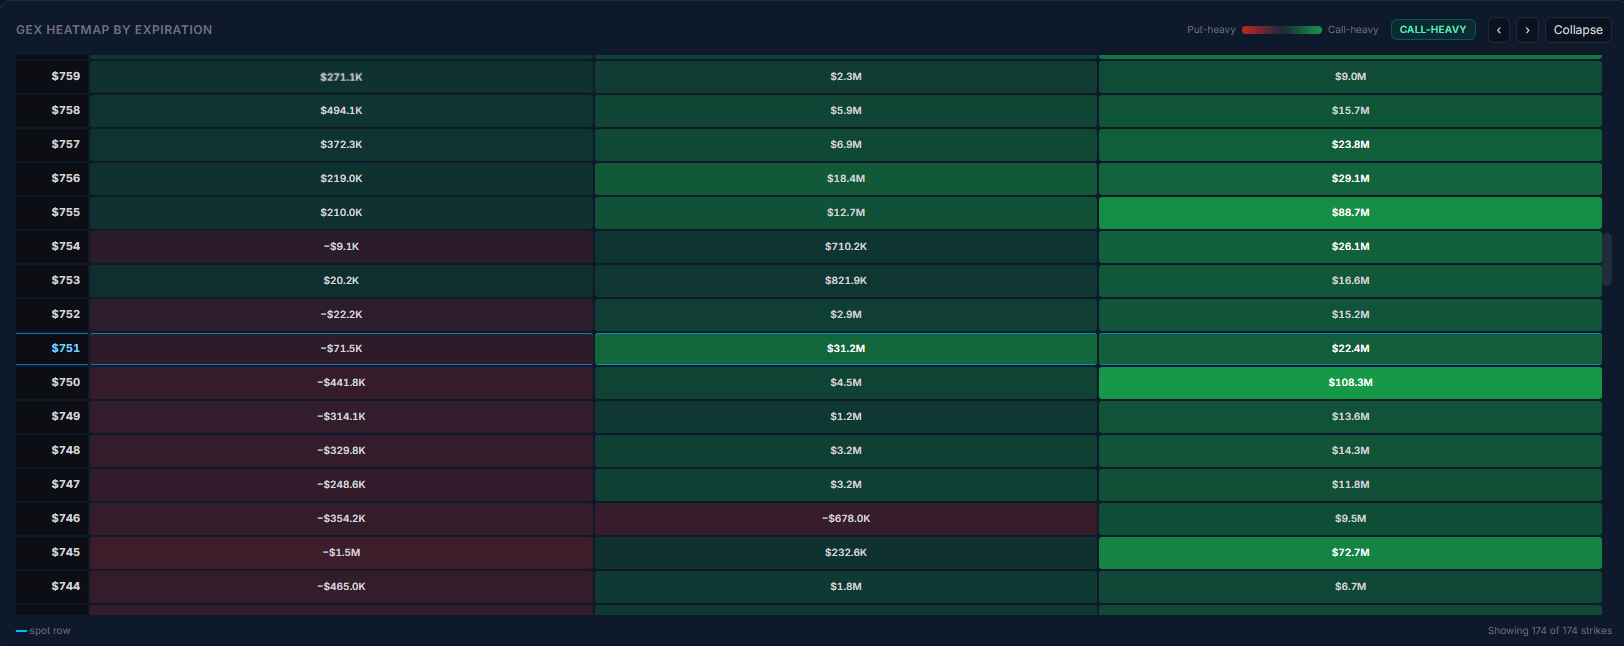
Below the stats sit a Gamma Market Regime card and a Call/Put open-interest sentiment gauge, then a toggle between a GEX-by-strike chart and a price chart with level overlays, a gamma-by-expiry breakdown, and a GEX heatmap by strike × expiration (green = call-heavy, red = put-heavy, with a 0DTE filter and an expand-to-full-chain view). Expected Moves by Expiry and the Top Gamma Walls panel round it out. The methodology drawer in the header explains exactly how each block is built.
Put it to work
Use the top gamma walls and max pain as reference levels for the session — a positive (call) wall and a negative (put) wall often act as magnet or friction zones, and a positive net GEX regime tends to dampen moves while a negative one tends to amplify them. Use "Share / Copy Levels" to copy a plain-text summary of the current ticker's levels.