
What it is
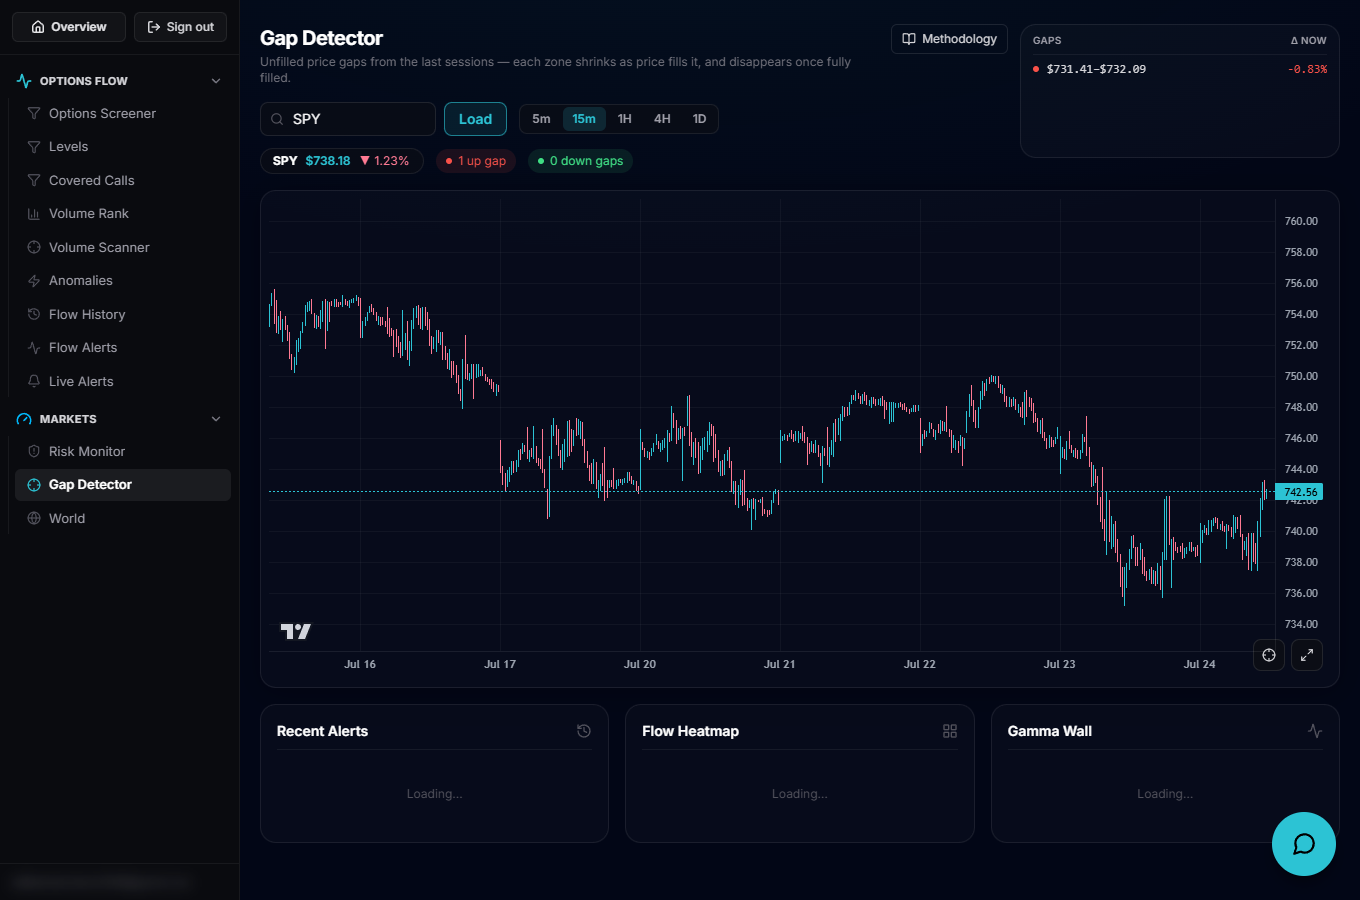
The Gap Detector marks unfilled price gaps — ranges the market jumped over between one candle and the next, that price hasn't traded back through — as shaded zones on a candlestick chart. Each zone shrinks as price fills it, and disappears once fully filled, so what you see is only what remains open.
Open it
Use the left rail to open Gap Detector, which loads at /account/gap. An older bookmark to /account/fvg redirects straight here as well — it's the same page. An active subscription is required.
Ticker and timeframe
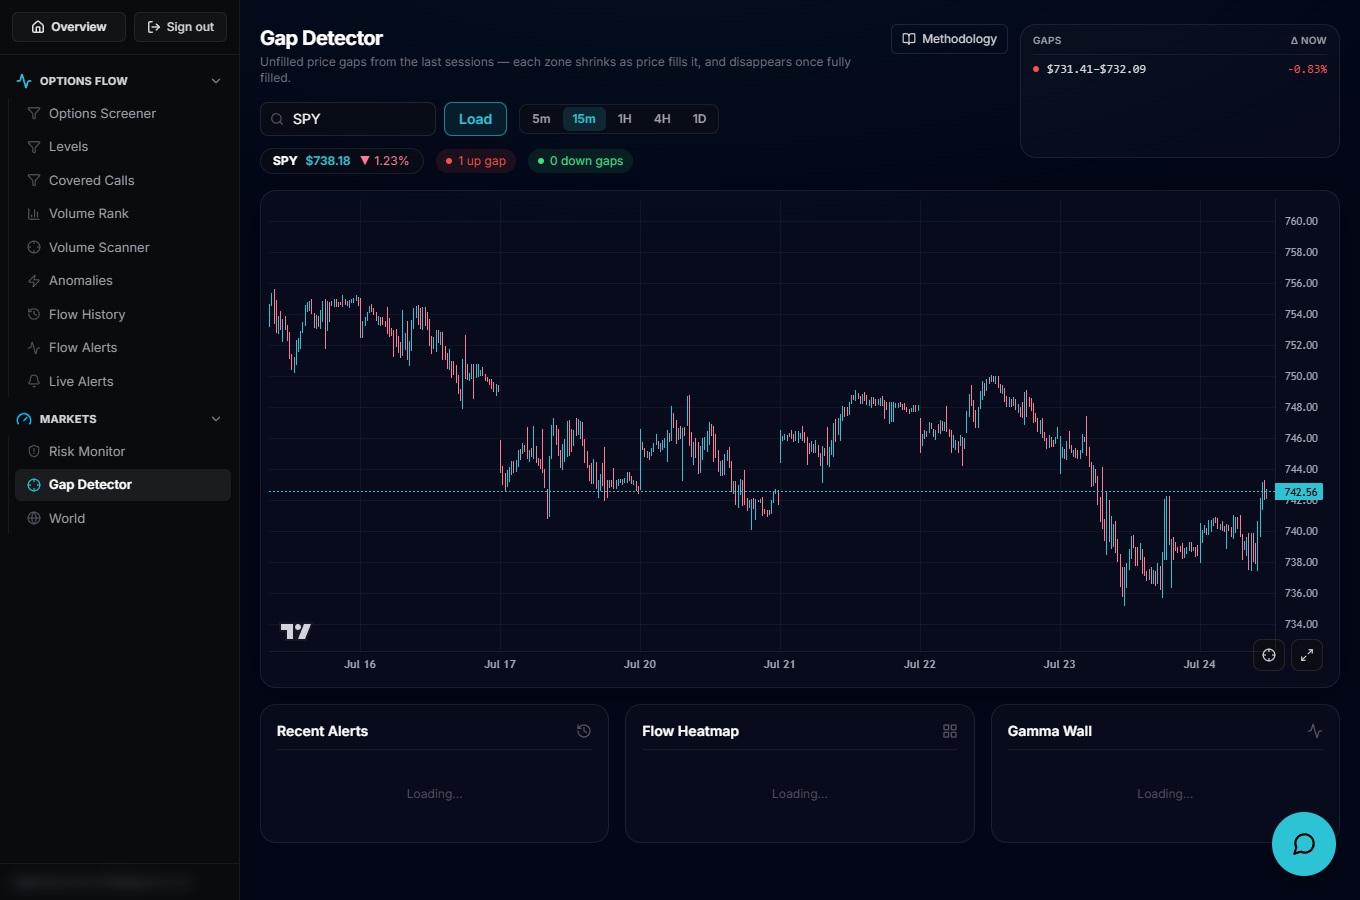
Type a ticker into the search box and click Load, and pick a candle interval — 5m, 15m, 1H, 4H or 1D — from the pills next to it. Higher timeframes surface fewer, larger gaps; lower timeframes surface many small ones. A price pill next to the ticker shows the live price and % change, alongside a count of up gaps and down gaps currently open.
Reading the chart and gap list
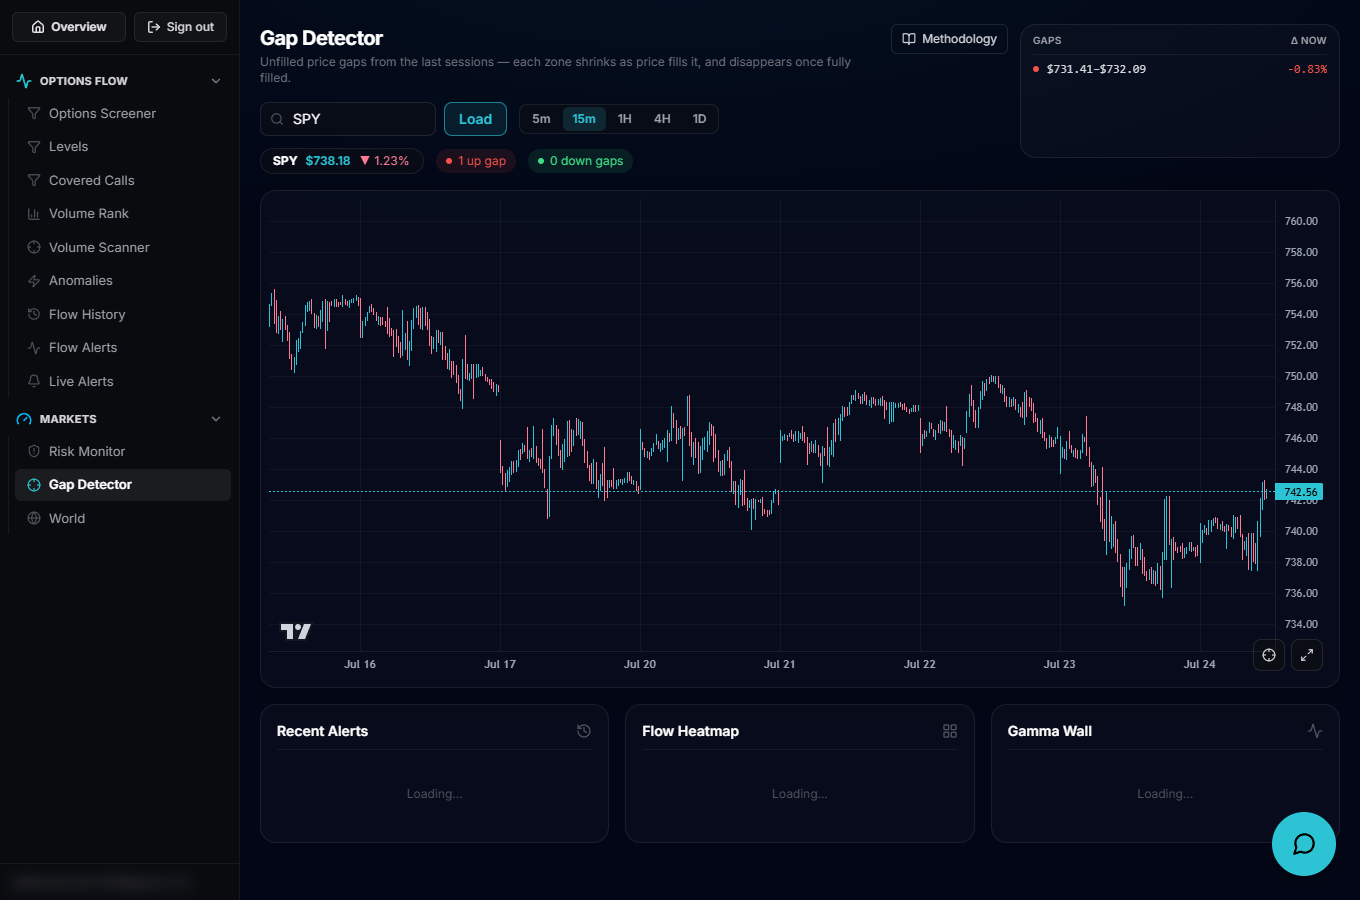
Each shaded zone on the chart is one open gap; a bearish (down) gap sits above the current price and a bullish (up) gap sits below it. Alongside the chart, a Gaps panel lists every open gap for the loaded ticker with its price range and its % distance from the current price, sorted nearest-first.
The supporting pods
Below the chart, three cards add options-flow context for the same ticker: Recent Alerts (recent whale options trades with a call/put ratio for the day), Flow Heatmap (the day's largest trades by premium, calls vs. puts), and Gamma Wall (spot, max pain, gamma flip and the nearest gamma walls). The methodology drawer in the header explains exactly how a gap is detected and how its zone shrinks or fills.
Put it to work
Gaps often — not always — get filled as price revisits the range, so treat an open gap as a reference zone to watch rather than a signal to act on alone. Weigh higher-timeframe gaps (1D/4H) more heavily than intraday (5m) ones, and cross-check a gap's direction against the Gamma Wall and Flow Heatmap pods for the same ticker before reading too much into it.