
Live Options Flow & Screener
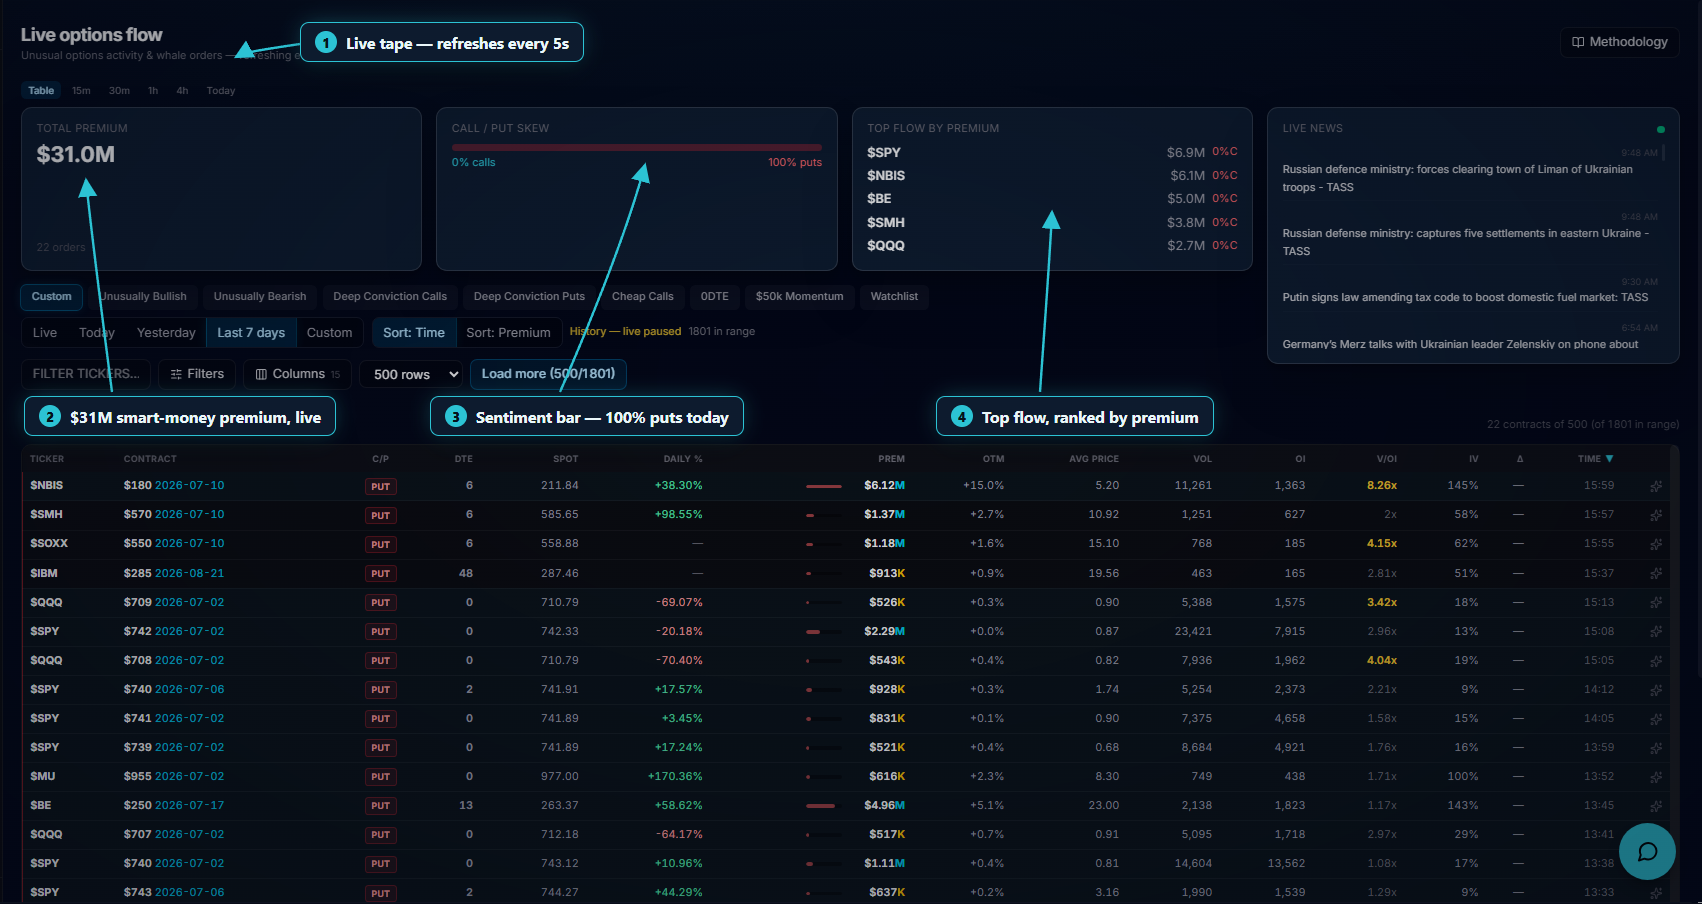
The core view — live whale options orders streaming in real time, with filters, watchlist, charts and a whale directional bias on every contract. This is also the Options Screener.
What it is
Live Options Flow is the main dashboard view: unusual options activity and whale orders across actively-traded US-listed names, streaming in as they're detected. The left-rail "Options Screener" link is the same feature — /account/screener redirects straight here, so any bookmark to the old screener still lands on the live flow.
Open it
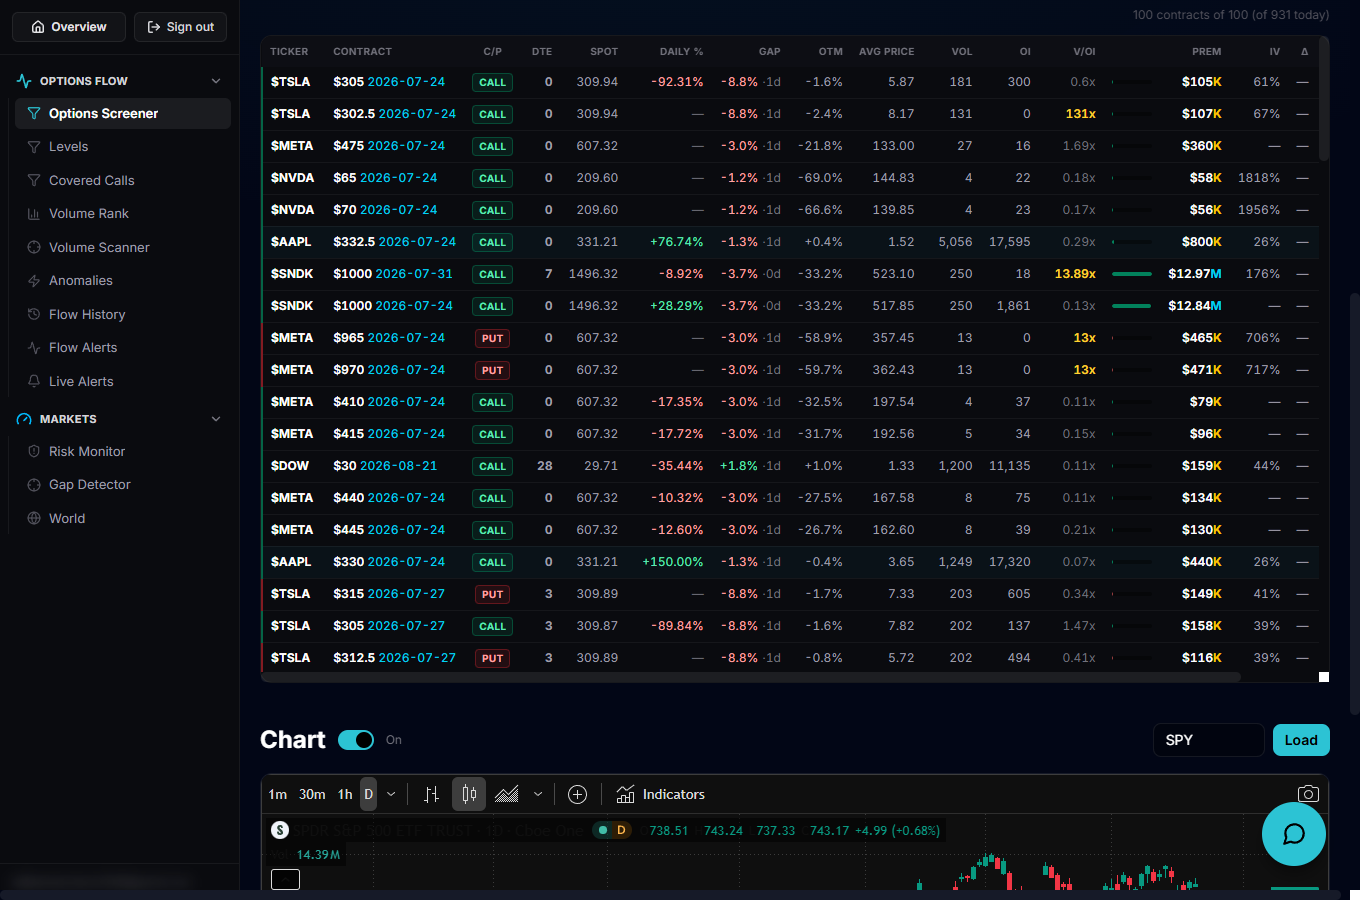
Sign in and use the left-rail navigation to reach Live Options Flow / Options Screener, which opens at /account/dashboard. It's the page you land on first after signing in.
Filter, preset and sort
Pick a quick preset (Unusually Bullish/Bearish, Deep Conviction Calls/Puts, Cheap Calls, 0DTE, $50k Momentum, Watchlist…) or open Filters for fine-grained ranges on premium, volume, open interest, Vol/OI, IV, DTE, %OTM, delta and more, plus toggles like Sweep only, OTM only and Exclude 0DTE. A ticker box narrows to one symbol, the Columns menu shows/hides and reorders fields, and Grouped/All prints switches between one row per contract or the raw print-by-print tape.
Read a row
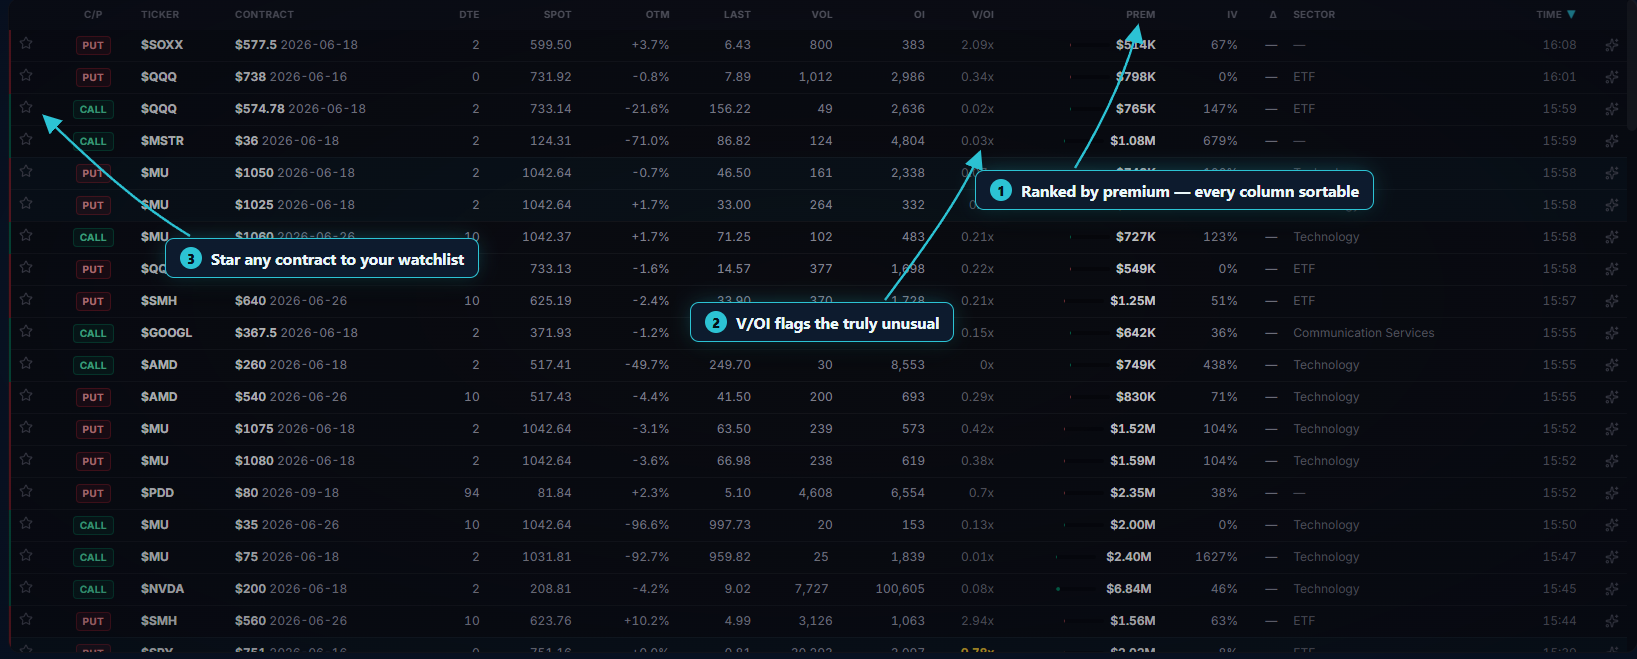
Each row shows the ticker, contract (strike/expiration), call or put, DTE, spot price, daily %, %OTM, average fill price, volume, open interest, Vol/OI, premium, IV and the Greeks. The bid/ask and bullish/bearish bars are derived from the NBBO: a call near the ask (or put near the bid) counts as bullish volume, and the reverse counts as bearish — sortable columns include Premium, Vol/OI, IV, DTE and Time.
Go deeper on a contract
Click a row to expand it: the dashboard loads that contract's intraday volume/premium history and a whale directional bias badge (Bullish/Bearish/Neutral, or a dash when there isn't enough data) computed from the day's whale flow on that ticker. Below the table, an interactive TradingView chart lets you look up any ticker's price action alongside the flow.
Put it to work
Star a ticker to add it to your watchlist, then turn on the Watchlist only toggle (or the Watchlist preset) to see only the names you're tracking. Combine that with a preset like Unusually Bullish or Deep Conviction Calls to catch when your own watchlist starts showing heavy, one-sided whale activity.