
Individual Option Contract Charts & Precision Greeks
Inspect any option contract with dedicated high-speed candlestick charting, real-time volume bars, live bid/ask spreads, and exact Greek risk metrics—with instant at-the-money discovery for every stock.
Why option contracts require independent price discovery
When an unusual flow alert catches your eye or an underlying stock breaks out of key resistance, analyzing only the underlying equity chart is fundamentally insufficient for active options trading. Options are non-linear derivatives whose market prices move based on a complex interplay of directional movement, accelerating time decay, changing implied volatility, and shifting order book liquidity.
An underlying stock might gain one percent while an out-of-the-money call option surges fifty percent—or unexpectedly loses value due to sharp volatility contraction following an earnings announcement. Evaluating option setups exclusively through equity charts forces you to guess whether a premium move was caused by real buyer accumulation or artificial bid/ask spread distortion.
Our new dedicated contract charting interface solves this by treating every individual call and put as an autonomous financial asset with its own open, high, low, close, and traded volume history. You can now analyze true premium behavior directly before committing capital to a trade.
- Underlying stock price charts completely hide contract-specific intraday momentum, time decay curves, and volatility expansion.
- Sudden bid/ask spread widenings can severely distort your fills if you cannot inspect historical execution levels.
- Contract-level volume histograms reveal institutional accumulation and sudden liquidity dry-ups that equity charts cannot display.
- Direct premium charting enables precise support and resistance mapping directly on option strike price levels.
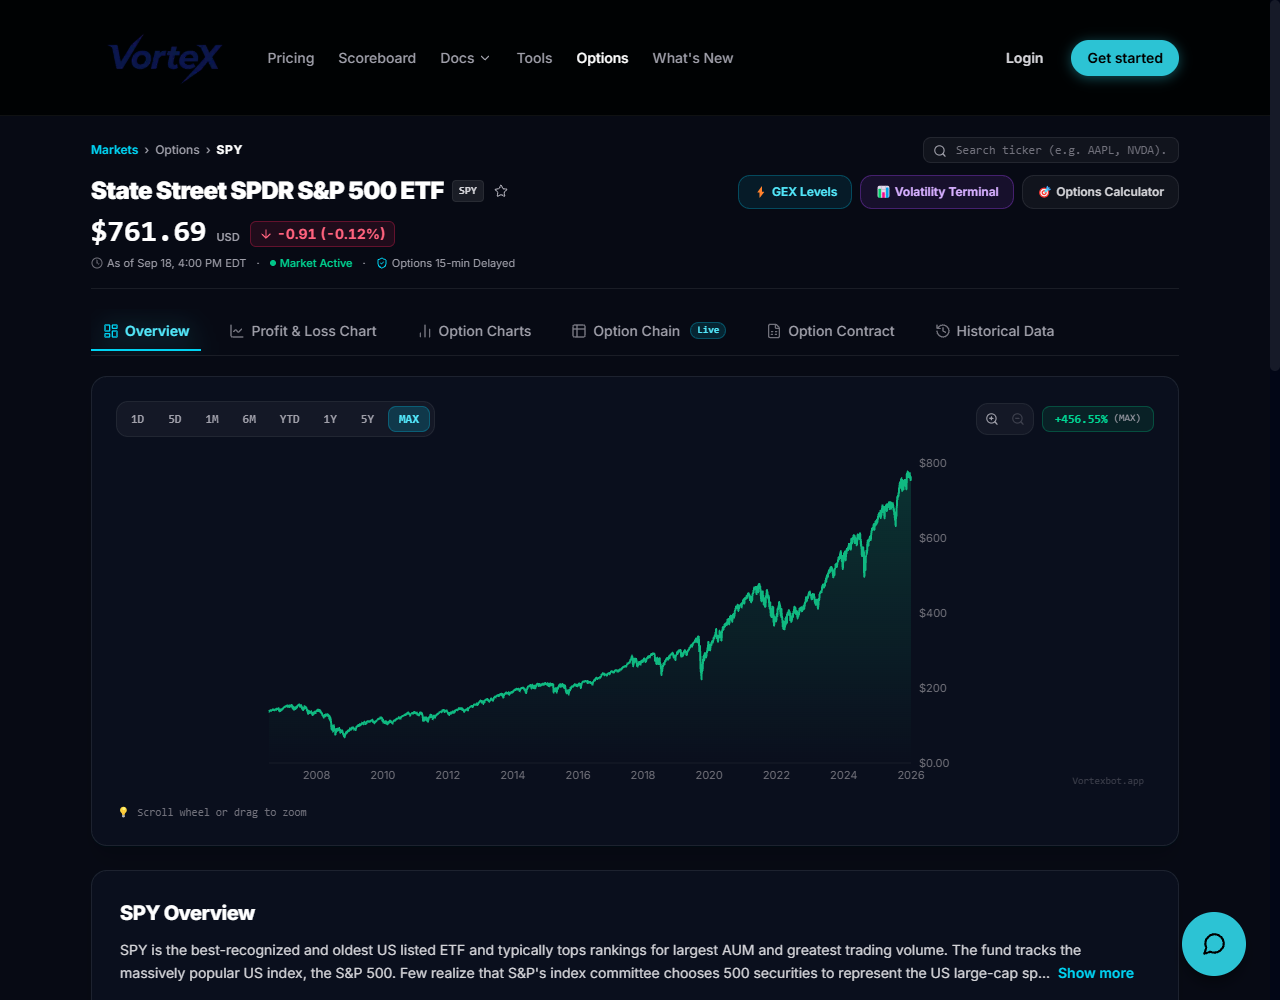
Interactive contract selection and navigation
Locating the exact contract you want to analyze is completely seamless. Rather than navigating through cumbersome legacy multi-window tables or manual search boxes, all contract navigation controls are unified directly inside the interactive header bar above the chart area.
When you open any ticker, the interface automatically resolves and loads the active At-The-Money (ATM) contract for the front expiration cycle, placing you directly in front of the most liquid and actively traded strike on the board without a single manual click.
Switching between bullish and bearish setups takes a single tap: clicking the Call/Put toggle immediately switches the underlying contract while preserving your selected strike distance and charting zoom preferences.
- Step 1: Open any ticker URL or search bar to land automatically on the primary At-The-Money contract.
- Step 2: Toggle between Calls and Puts with one click to instantly contrast premiums, volume, and implied volatility.
- Step 3: Access the strike selector dropdown to quickly browse In-The-Money, At-The-Money, and Out-Of-The-Money strikes.
- Step 4: Switch effortlessly between Candlestick and Line view to alternate between granular execution timing and macro trend analysis.
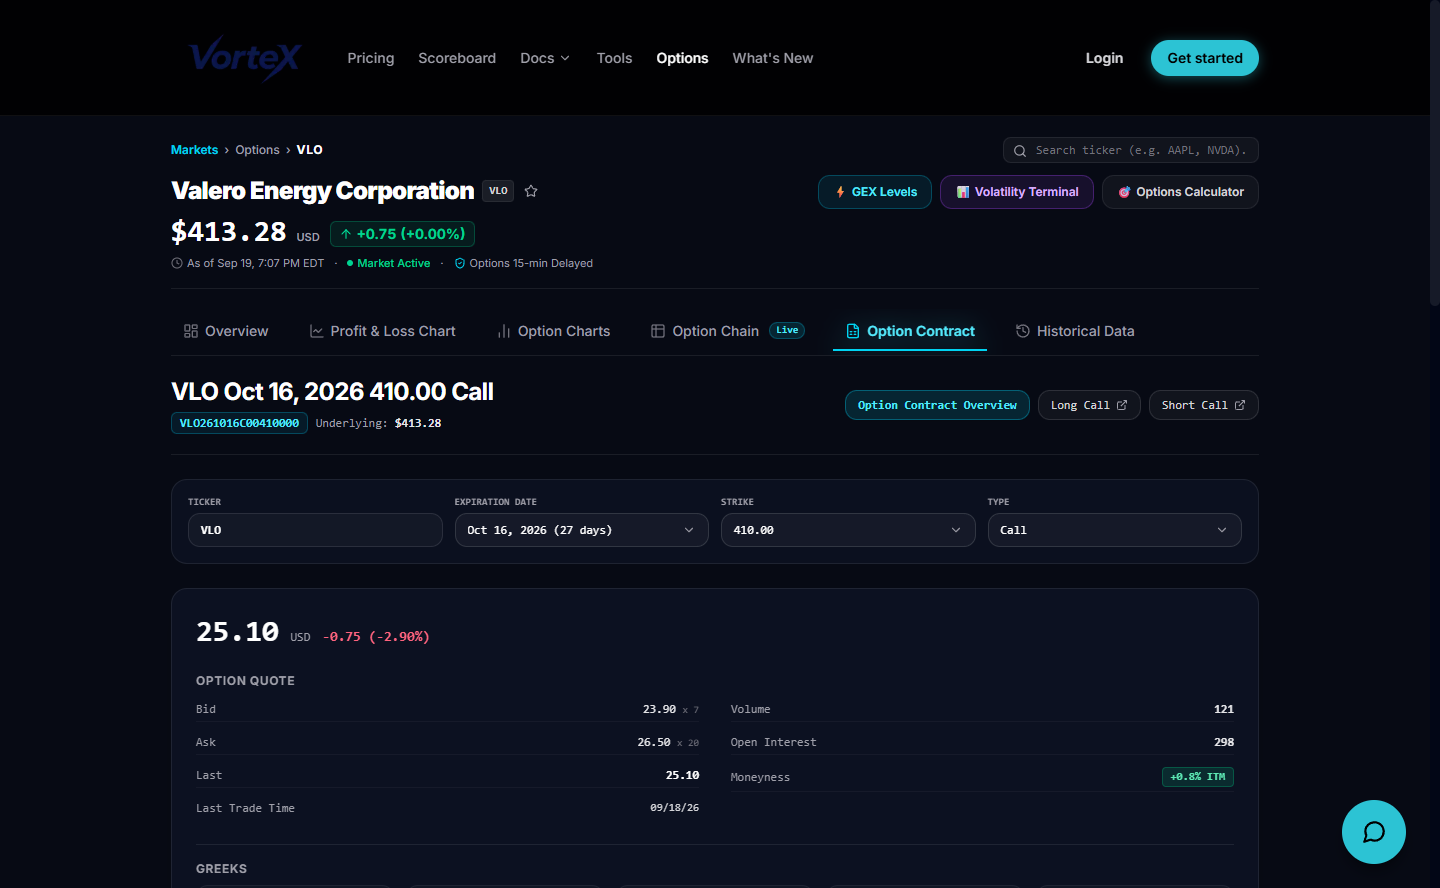
Granular expiration cycles from 0DTE to LEAPS
Options traders operate across radically different time horizons. A day trader seeking rapid momentum requires same-day zero-days-to-expiration (0DTE) contracts, while a macro swing trader or hedger requires monthly cycles or multi-year long-term equity anticipation securities (LEAPS).
The interactive expiration selector organizes every available market cycle in chronological order, displaying clear calendar dates alongside exact days-to-expiration counters. This allows you to evaluate term structure and calendar roll opportunities without performing mental date calculations.
Changing the expiration instantly recalculates the contract Greeks, updates the historical price series, and refreshes the order book quotes in real time.
- Full market cycle coverage spanning intraday 0DTE, weekly, monthly, and multi-year LEAPS contracts.
- Clear calendar dates paired with automatic days-to-expiration countdowns for fast horizon matching.
- Instantly compare short-dated contracts with higher Gamma against longer-dated contracts insulated from rapid decay.
- Seamless cycle switching without losing your charting position or underlying ticker context.
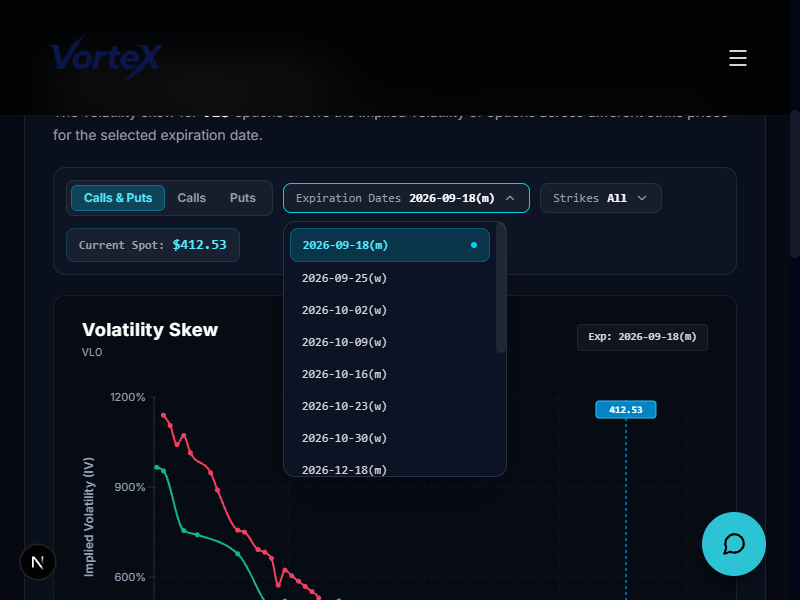
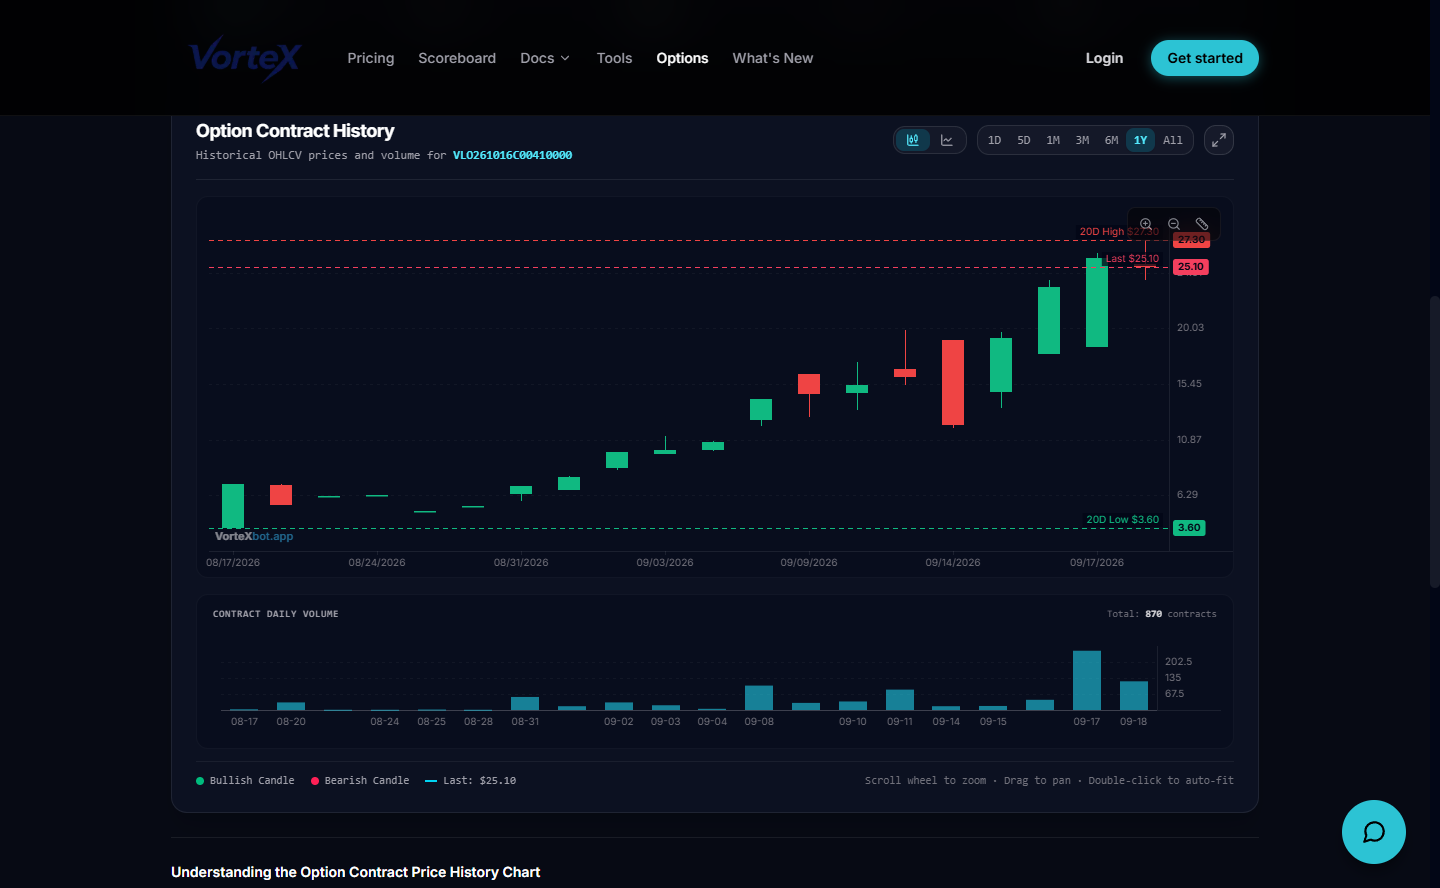
Precision candlestick price action with synchronized volume
Our custom candlestick engine gives you institutional-grade visual clarity into the exact premium fluctuations of any option contract. Every candle plots the true open, high, low, and close of traded contracts across your chosen timeframe, providing authentic price action context.
Directly underneath the main price pane, an aligned volume sub-chart illustrates the exact number of contracts exchanged during each trading period. High-contrast bull and bear coloring highlights buyer-dominated accumulation versus seller-driven distribution.
A zero-lag crosshair tracks your mouse cursor across both price and volume panes concurrently, displaying exact numeric values in an ultra-compact hover readout that never blocks the chart data.
- High-density candlestick bars allow you to spot wick rejections, hammer reversals, and premium breakouts.
- Synchronized contract volume bars confirm whether a premium spike was driven by institutional blocks or thin retail liquidity.
- Smooth crosshair tracking displays simultaneous price, time, and volume data points across the entire chart display.
- Clean visual contrast ensures effortless readability across both bright daylight conditions and late-night dark mode sessions.
Line chart mode for macro premium trajectories
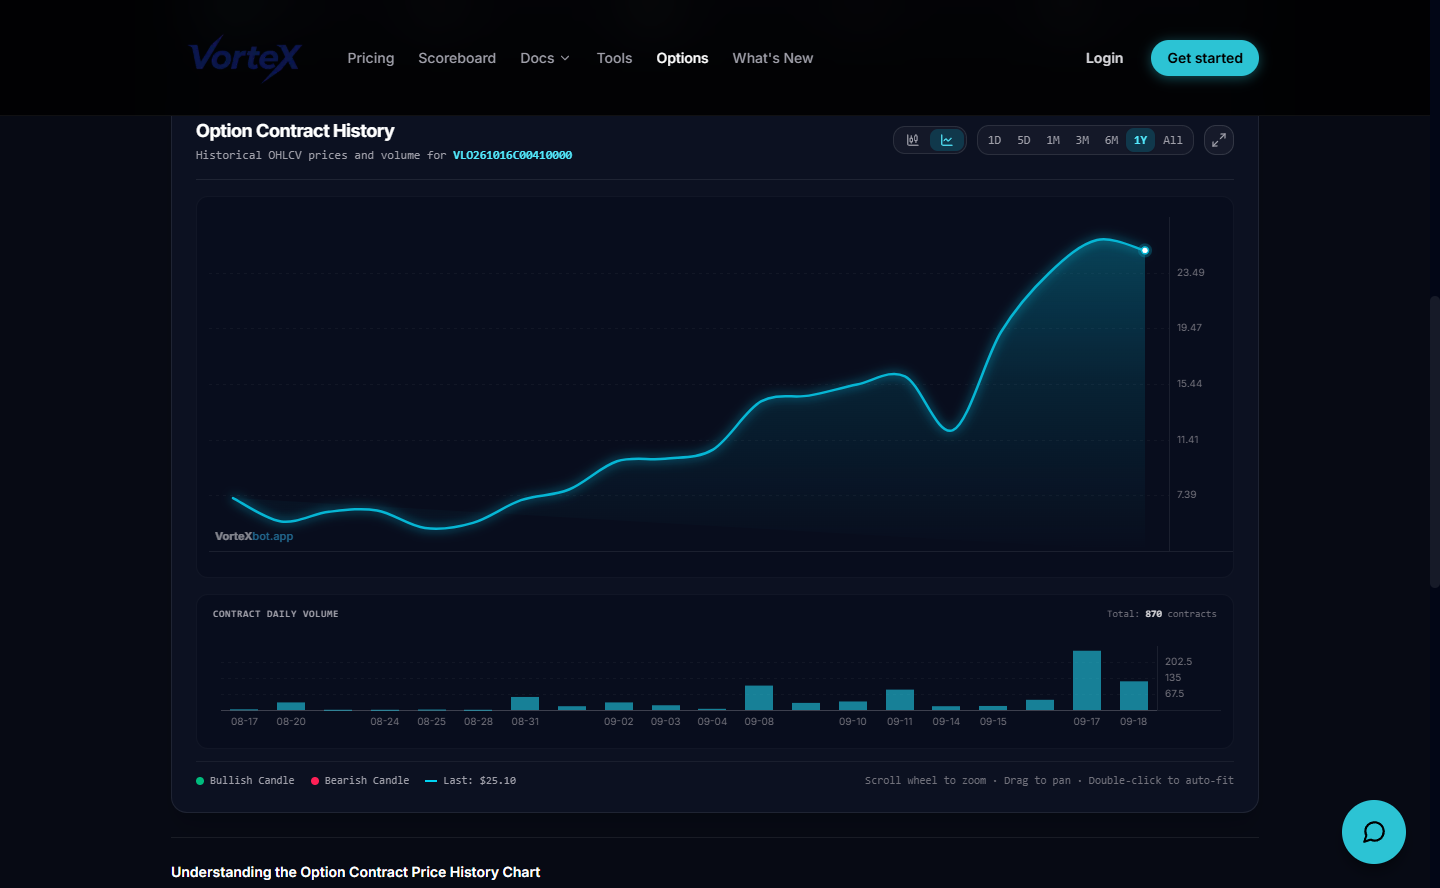
While candlestick charts are essential for tactical entry timing and analyzing intra-period wick rejections, excessive detail can sometimes obscure the broader trend. Line chart mode provides a smooth, continuous area curve that highlights macro premium trajectories over extended holding periods.
By focusing on closing price trajectories with subtle gradient fills beneath the curve, line mode makes it easy to identify multi-week support shelves, progressive consolidation patterns, and volatility compression zones prior to major earnings or economic announcements.
Switching between line mode and candlestick mode is instantaneous via the toolbar toggle, allowing you to alternate between high-detail tactical execution and big-picture structural awareness in seconds.
- Clean gradient area fill accentuates multi-week trend direction and long-term consolidation boundaries.
- Filters out transient wick noise to clarify true holding value for multi-day swing positions.
- Ideal for tracking premium appreciation curves on LEAPS and multi-month calendar spreads.
- Instantly toggled from the top navigation bar without interrupting active chart telemetry.
Fluid zooming, panning, and instant viewport reset
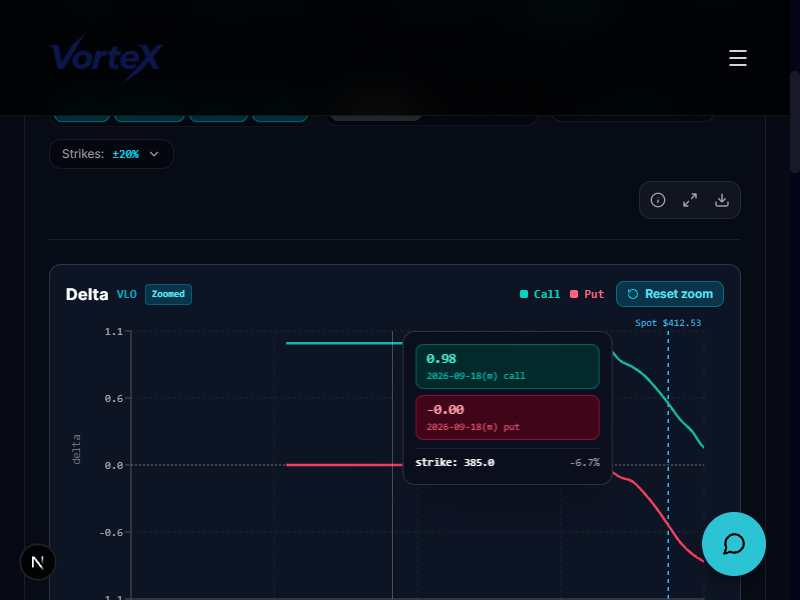
Market dynamics change rapidly, requiring you to alternate between multi-month historical overviews and high-frequency intraday price surges. The charting workspace features full mouse-wheel zooming and interactive click-and-drag range selection.
You can scroll your mouse wheel forward to zoom directly into a specific trading cluster, or drag horizontally across a time window to isolate the exact morning opening drive. Text selection highlighting is completely disabled across all chart containers, guaranteeing smooth and distraction-free mouse interactions.
Whenever you zoom into a custom timeframe, a dedicated Reset Zoom badge appears in the top header row. Positioned neatly alongside the controls, it never floats over your candlesticks, and clicking it immediately restores the default full-range view.
- Intuitive mouse wheel zooming allows smooth magnification into dense high-volume trading windows.
- Horizontal click-and-drag selection lets you pinpoint exact opening and closing bell momentum drives.
- Non-obstructive Zoom HUD sits in the top control bar, keeping the chart workspace clean and unblocked.
- One-click reset button instantly snaps your view back to the full contract trading history.
Filtering strikes to focus on high-probability zones
Modern equity option chains can feature hundreds of active strike prices spanning across wide ranges. Browsing through vast strike lists manually introduces friction, increases cognitive load, and diverts your focus away from the most actionable trade opportunities.
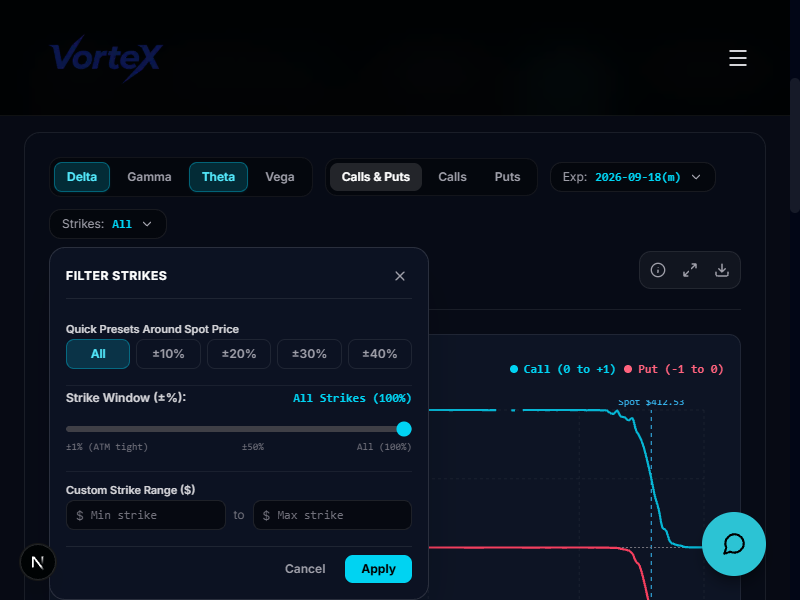
Our strike filtering controls allow you to narrow down the visible chain to specific strike ranges centered around current spot prices. Whether you are hunting for high-gamma At-The-Money contracts or filtering for out-of-the-money lotto sweeps, you can isolate the strikes that matter to your trading strategy.
By constraining your field of view to the relevant delta bands, you can quickly compare premium pricing, bid/ask spreads, and open interest distribution across neighboring strikes before executing.
- Quickly isolate near-the-money strike corridors to eliminate distracting deep out-of-the-money noise.
- Easily compare premium costs across adjacent strikes to select the most favorable risk/reward structure.
- Speed up trade preparation during volatile market openings when speed of execution is critical.
- Seamlessly expand your filter range whenever you need to inspect broader multi-strike positioning.
Evaluating order book depth, spreads, and execution quality
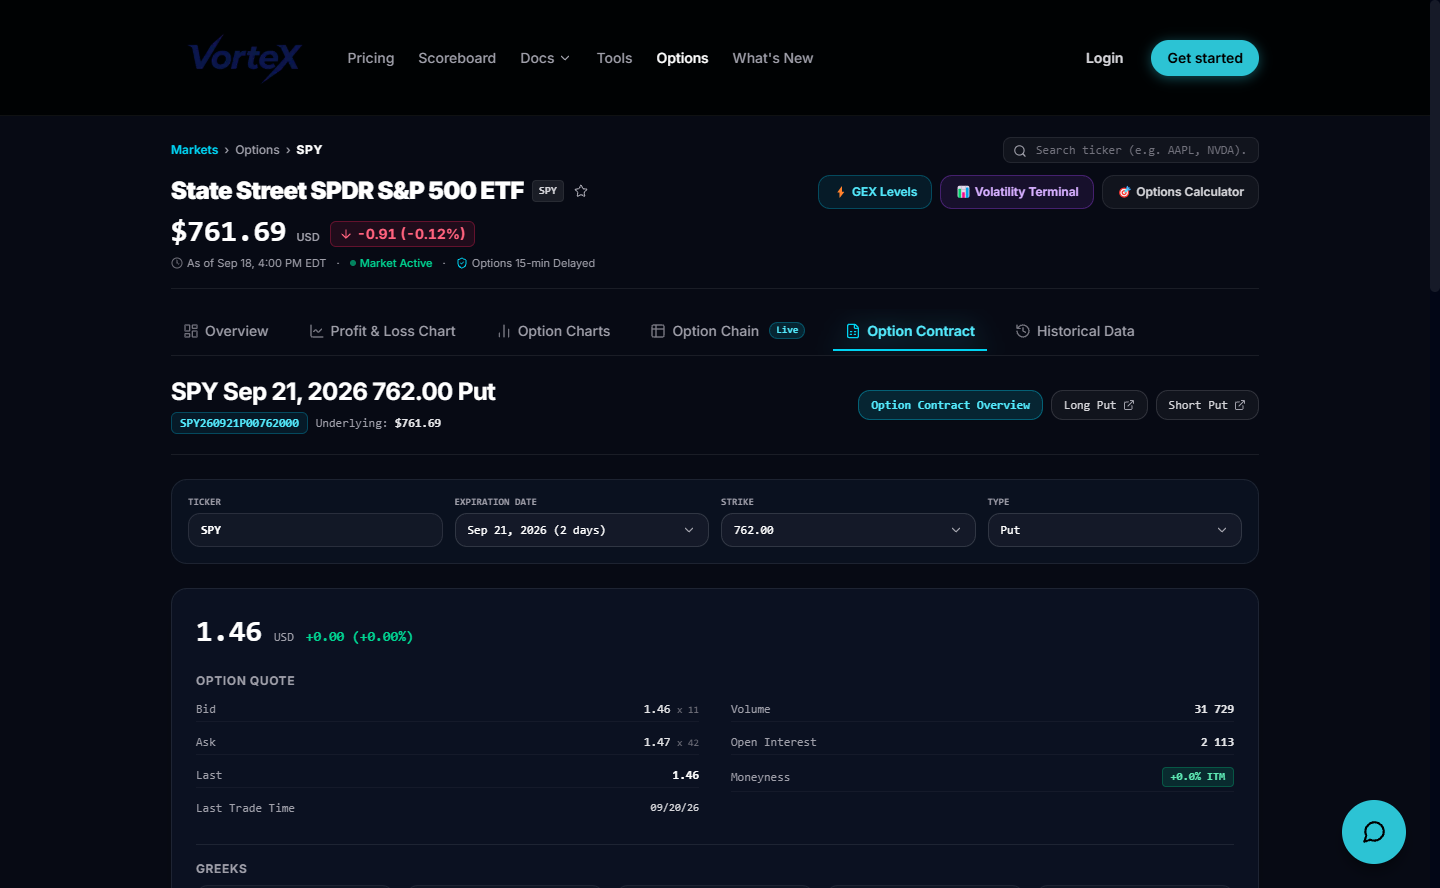
Even the most accurate directional prediction will result in an unprofitable trade if you enter on an illiquid contract with an excessively wide bid/ask spread. The live quote card directly adjacent to the chart provides continuous transparency into exchange order book conditions before you submit an order.
The panel displays real-time bid, ask, and calculated midpoint prices, paired with standing bid size and ask size measurements. Seeing twenty contracts on the bid versus five hundred on the ask immediately alerts you to institutional resistance or potential fill slippage.
In addition to real-time quotes, the card computes the contract's exact Moneyness percentage, compares current traded volume against prevailing Open Interest, and tracks net price change from the previous session close.
- Live bid size and ask size indicators reveal exchange market depth and prospective slippage before you trade.
- Exact spread width and midpoint calculations ensure you never overpay during high-volatility spikes.
- Calculated Moneyness percentage shows precisely how far in or out of the money the contract currently sits.
- Volume vs. Open Interest ratio highlights fresh institutional positioning and unusual contract turnover.
Reading directional risk with Delta and Gamma
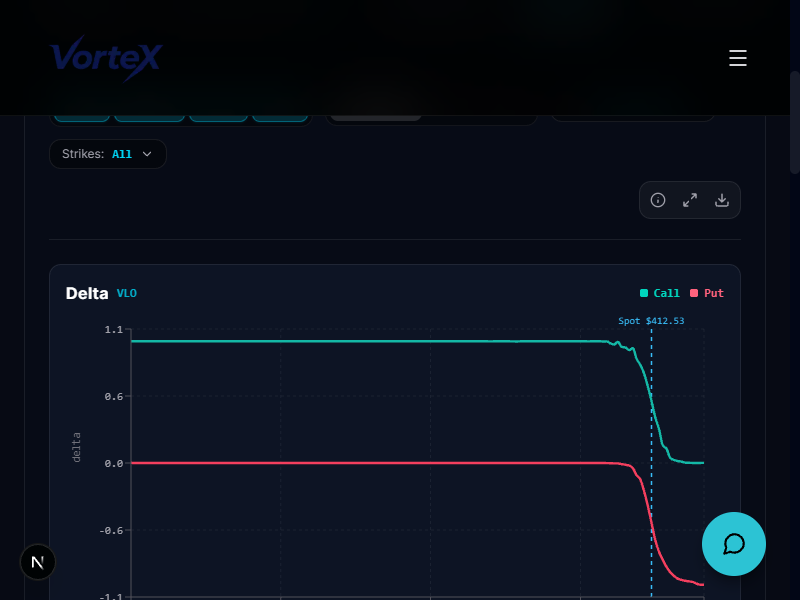
Option contracts are driven by mathematical risk metrics known as the Greeks. Delta quantifies the expected change in option premium for every one-dollar move in the underlying stock price, acting as both an equivalent share multiplier and an approximate probability of expiring in the money.
Gamma measures the acceleration rate of Delta. When you hold an At-The-Money contract with high Gamma, any sudden breakout in the underlying stock causes Delta to surge rapidly toward one hundred, transforming a modest directional move into an explosive percentage gain.
By monitoring Delta and Gamma simultaneously on the contract overview, you can size your positions appropriately, ensuring your directional leverage matches your personal risk tolerance.
- Delta indicates your dollar-per-point exposure and serves as an empirical probability proxy for expiration.
- Gamma highlights explosive leverage potential on near-the-money options during sharp underlying momentum.
- Helps you balance strike selection between safer high-delta contracts and high-velocity low-cost plays.
- Real-time metric updating ensures your risk calculations reflect current market movements continuously.
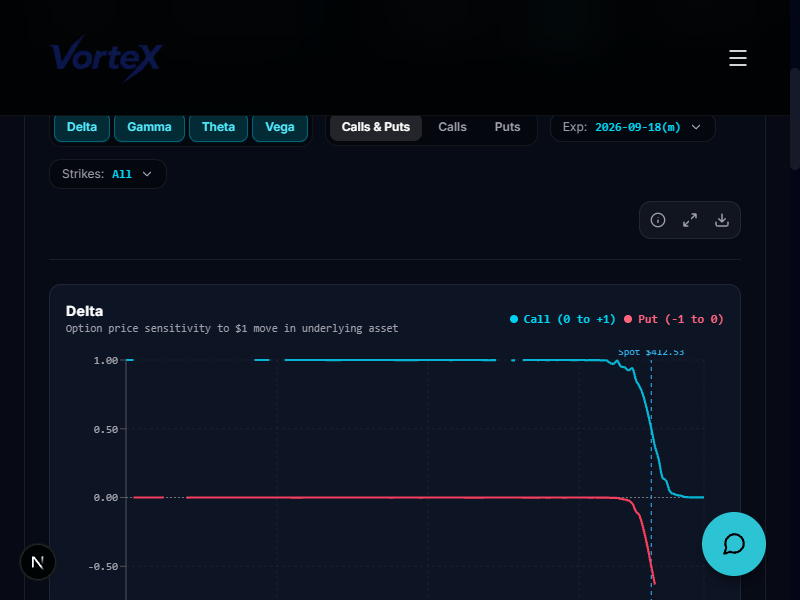
Mastering time decay and volatility risk with Theta and Vega
While Delta and Gamma govern directional sensitivity, Theta and Vega determine how your position performs over time and across changing market sentiment. Theta quantifies calendar decay—the exact dollar amount your contract premium loses with each passing twenty-four-hour period.
Time decay accelerates exponentially as expiration approaches, particularly within the final twenty-one days of a contract lifecycle. Being able to see your daily holding cost before entering a swing trade prevents you from holding deteriorating contracts through stagnant weekend sessions.
Vega measures contract sensitivity to shifts in Implied Volatility. If you buy contracts right before major corporate earnings, Implied Volatility collapses immediately after the event. A high Vega rating warns you that a volatility crush could erase your profits even if the underlying stock moves in your favored direction.
- Theta quantifies daily holding decay in concrete dollar terms so you never underestimate overnight decay risk.
- Vega highlights exposure to volatility spikes and post-earnings volatility contraction.
- Implied Volatility indicators show whether options are currently trading at a premium or discount.
- Crucial risk awareness for avoiding holding decaying swing trades through quiet consolidation periods.
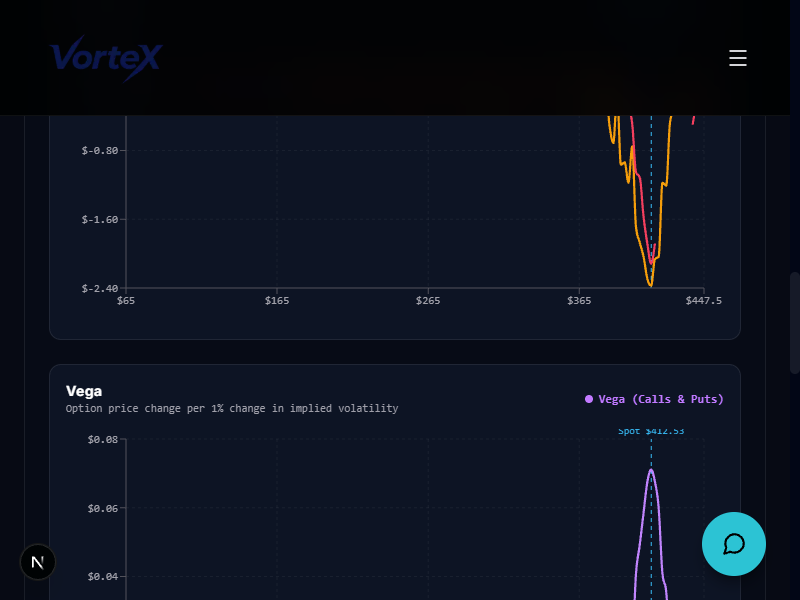
Comprehensive Greek risk metrics at a single glance
To make sound risk management decisions during rapid trading sessions, you need all critical parameters consolidated into a single coherent interface. Our horizontal Greeks bar unifies Delta, Gamma, Theta, Vega, and Implied Volatility into clean, high-contrast metric badges.
Each metric is calculated dynamically from live exchange data, ensuring that your evaluation of directional risk, calendar decay, and volatility sensitivity is synchronized with actual market pricing.
Whether you are evaluating a short-dated momentum scalp or balancing a complex multi-leg hedged position, having all Greeks displayed alongside live price action eliminates guesswork and accelerates trade validation.
- Unified horizontal dashboard presents Delta, Gamma, Theta, Vega, and Implied Volatility side by side.
- Real-time recalculation reflects evolving market prices, spot drift, and daily calendar progression.
- Clean visual badge styling guarantees immediate legibility without visual distraction or clutter.
- Provides a complete mathematical profile of contract risk before capital is committed to an order.
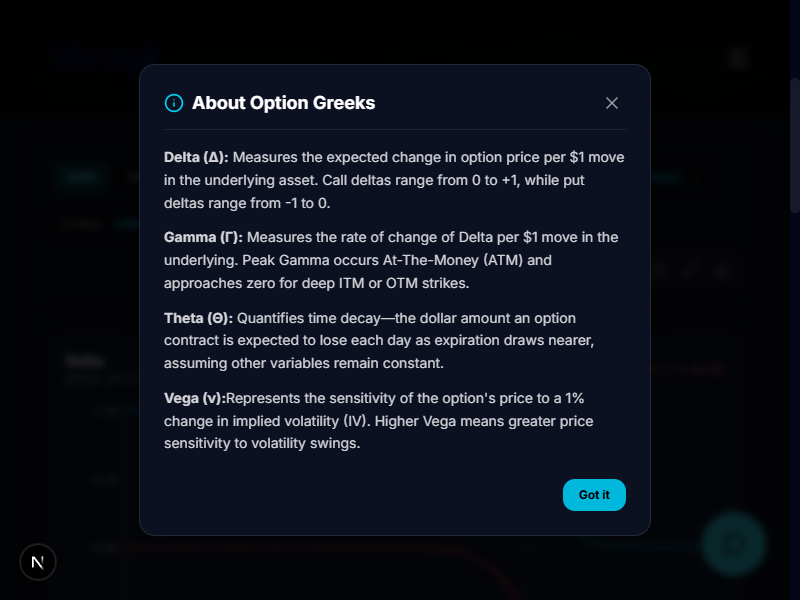
Educational risk breakdown modal for informed execution
Greeks can often feel abstract or intimidating, especially for traders transitioning from spot shares to derivative markets. To support continuous trader growth, the interface includes an interactive educational risk modal accessible directly from the Greeks panel.
Opening the guide reveals comprehensive breakdowns of how each Greek operates under real-world trading conditions. You will discover practical rule-of-thumb heuristics, such as how Delta approximates probability of expiring in the money, how Gamma peaks at the money, and how Theta accelerates during the expiration week.
By bridging the gap between theoretical derivative formulas and practical trade execution, this built-in reference tool empowers you to trade with conviction and manage portfolio risk with professional discipline.
- Interactive reference modal breaks down mathematical formulas into clear, actionable trading takeaways.
- Learn practical heuristics to optimize strike selection, manage decay, and protect against volatility crush.
- Accessible instantly with one click directly from the Greeks bar without leaving your charting workflow.
- Empowers traders of all experience levels to make disciplined, data-backed execution decisions.
Ready to trade this? Get the live whale flow, levels, and alerts.
See pricingEducational content — not financial advice.